McKinsey & Company
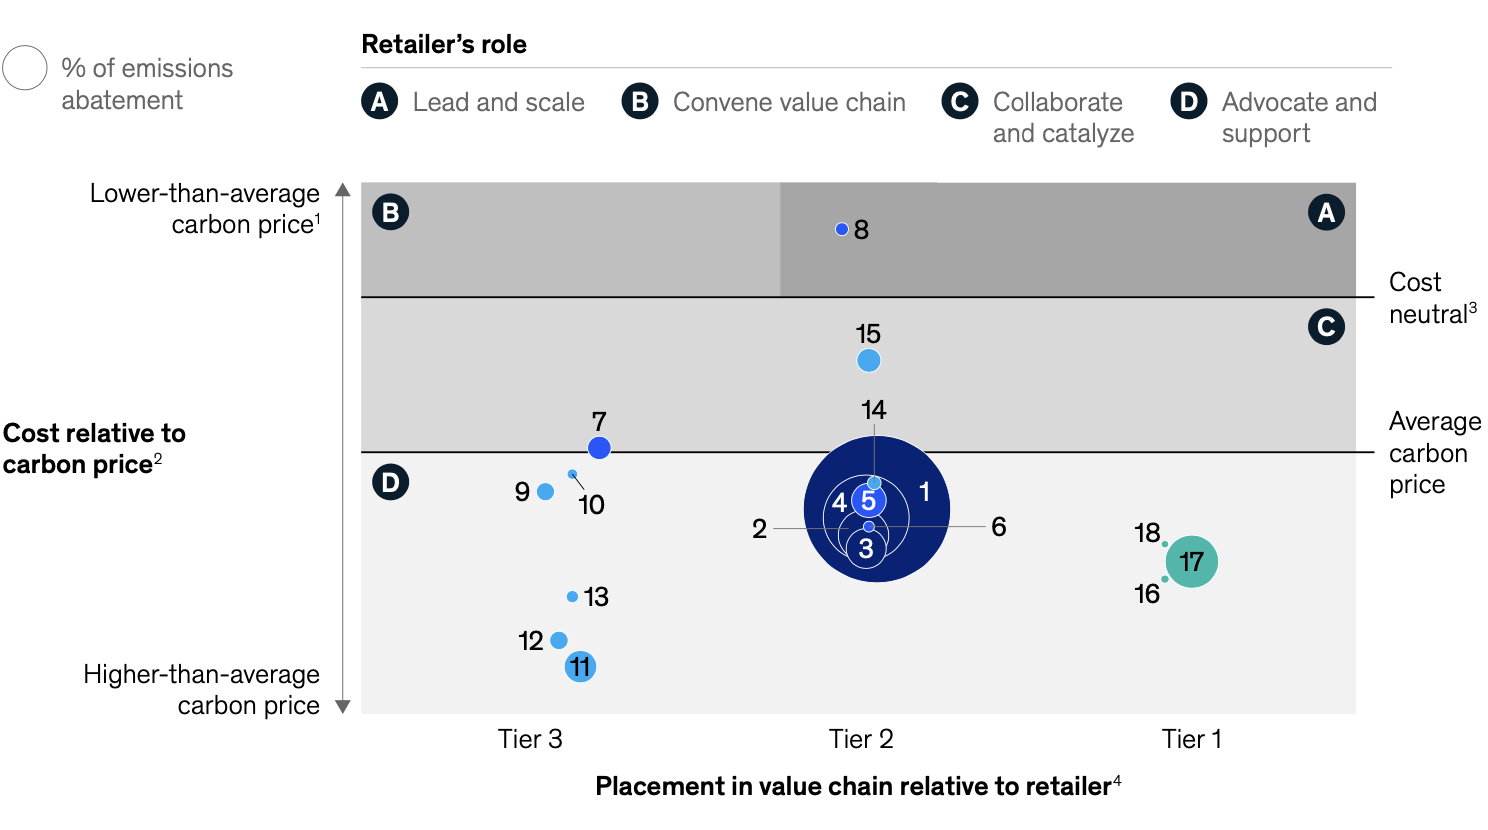
To reduce Scope 3 emissions from t-shirt, beef, and electronics production, retailers can prioritize actions based on their decarbonization potential and proximity in the value chain.
Note: Based on production for 60% cotton, 40% polyester t-shirt.
¹Using an average global carbon price of 50 $/metric ton (Mt) of CO₂ based on World Bank report that states that Network for Greening the Financial System’s modeling suggests that carbon prices need to be around $50 by 2030 in 2010 terms to achieve a below 2°C outcome (State and trends of carbon pricing, World Bank, May 2023) and based on McKinsey analysis that the required global carbon price in 2020 is ~$40–$80 to limit warming to 1.5ºC.
²Cost relative to carbon price is measured by benchmarking decarbonization costs against global average carbon pricing of $50 as the opportunity cost.
³Cost neutral refers to a reduction cost of $0/MtCO₂ equivalent.
⁴Tiers 1 and 2 represent a retailer’s immediate supplier network (ie, direct suppliers and their direct suppliers); further upstream in the value chain are tier 3 and tier 4+.
⁵Based on marginal abatement cost curve that covers Scope 3 upstream emissions, including raw material extraction, agriculture, processing, manufacturing, packaging, and transportation; excludes retail waste and end-of-life emissions.
⁶Electrification of transport, though it has emissions distributed across whole value chain, is attributed to action taker closest to retailer (tier 1 supplier) because of high level of influence over entire supply chain.
T-shirt production
Beef production
Electronics production

Polyester production
Abatement levers across the value chain⁵
Cracker carbon capture and storage
Biogas for heating
Renewable electricity
Biobased feedstock
1
2
3
4
Cotton cultivation
Regenerative agriculture
Organic agriculture
Switch to biodiesel in farm equipment and machinery
5
6
7
Garment manufacturing and logistics
Biomass boilers
Biogas for heating
Low-liquor dyeing machines
Renewable electricity
8
9
10
11
Geothermal energy
Manufacturing and processing waste reduction
Equipment efficiency redesign
12
13
14
Circular materials
Recycled cotton fibers
Closed-loop recycled polyester
15
16
Packaging and transportation
Electrification of transport⁶
Switch to recycled cardboard
17
18
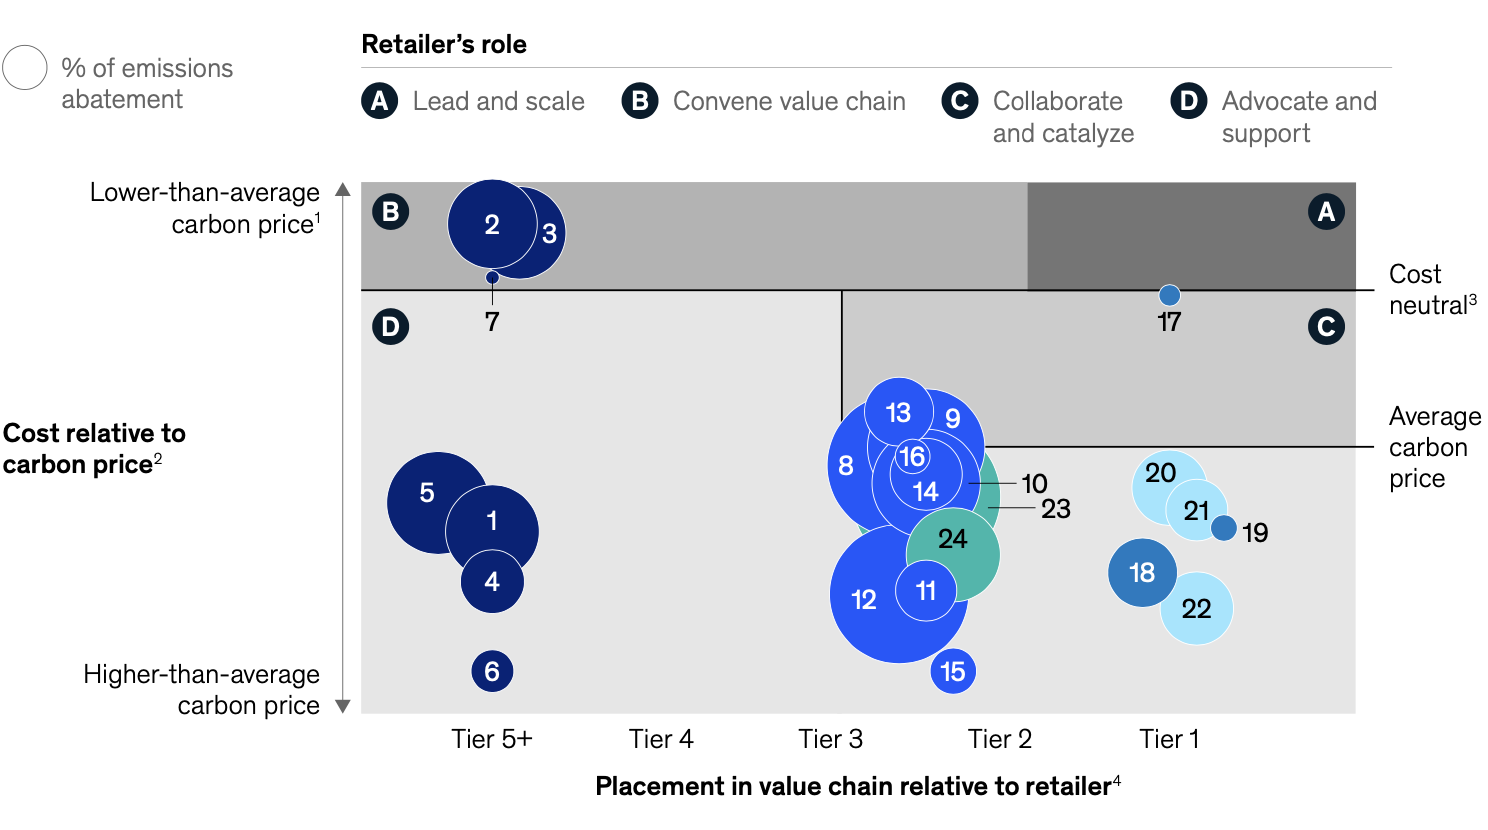
To reduce Scope 3 emissions from t-shirt, beef, and electronics production, retailers can prioritize actions based on their decarbonization potential and proximity in the value chain.
T-shirt production
Beef production
Electronics production
Animal feed
Abatement levers across the value chain⁵
Controlled-release and stabilized fertilizers
Variable-rate fertilization
Low or no tillage
Conversion from flood to drip or
sprinkler irrigation
Use of green ammonia infertilizer production
Biodiesel for on-farm machinery and equipment (feed farm)
Cover crops
1
2
3
4
Beef farming
Anaerobic manure digestion
Efficiency-focused breeding
Feed processing for improved digestibility
Ionophores (monensin)
Fat supplements in feed mix
Animal health monitoring and
illness prevention
Nitrogen inhibitors on pasture
Biodiesel for on-farm machinery
and equipment (beef farm)
Minimized time in feedlots
8
9
10
Transportation and packaging
Optimized packaging design
Electrification of transport⁶
Switch to recyclable plastics
17
18
19
Ecosystem
Management intensive grazing
Regenerative silvopastures
23
24
5
6
7
11
12
13
14
15
16
Processing
Renewable electricity in value chain (part cycle)
Renewable electricity in value chain (full cycle)⁶
Electrification of meat plants
20
21
22
McKinsey & Company
Note: Based on production for 60% cotton, 40% polyester t-shirt.
¹Using an average global carbon price of 50 $/metric ton (Mt) of CO₂ based on World Bank report that states that Network for Greening the Financial System’s modeling suggests that carbon prices need to be around $50 by 2030 in 2010 terms to achieve a below 2°C outcome (State and trends of carbon pricing, World Bank, May 2023) and based on McKinsey analysis that the required global carbon price in 2020 is ~$40–$80 to limit warming to 1.5ºC.
²Cost relative to carbon price is measured by benchmarking decarbonization costs against global average carbon pricing of $50 as the opportunity cost.
³Cost neutral refers to a reduction cost of $0/MtCO₂ equivalent.
⁴Tiers 1 and 2 represent a retailer’s immediate supplier network (ie, direct suppliers and their direct suppliers); further upstream in the value chain are tier 3 and tier 4+.
⁵Based on marginal abatement cost curve that covers Scope 3 upstream emissions, including raw material extraction, agriculture, processing, manufacturing, packaging, and transportation; excludes retail waste and end-of-life emissions.
⁶Electrification of transport, though it has emissions distributed across whole value chain, is attributed to action taker closest to retailer (tier 1 supplier) because of high level of influence over entire supply chain.
McKinsey & Company
To reduce Scope 3 emissions from t-shirt, beef, and electronics production, retailers can prioritize actions based on their decarbonization potential and proximity in the value chain.
Note: Based on production for 60% cotton, 40% polyester t-shirt.
¹Using an average global carbon price of 50 $/metric ton (Mt) of CO₂ based on World Bank report that states that Network for Greening the Financial System’s modeling suggests that carbon prices need to be around $50 by 2030 in 2010 terms to achieve a below 2°C outcome (State and trends of carbon pricing, World Bank, May 2023) and based on McKinsey analysis that the required global carbon price in 2020 is ~$40–$80 to limit warming to 1.5ºC.
²Cost relative to carbon price is measured by benchmarking decarbonization costs against global average carbon pricing of $50 as the opportunity cost.
³Cost neutral refers to a reduction cost of $0/MtCO₂ equivalent.
⁴Tiers 1 and 2 represent a retailer’s immediate supplier network (ie, direct suppliers and their direct suppliers); further upstream in the value chain are tier 3 and tier 4+.
⁵Based on marginal abatement cost curve that covers Scope 3 upstream emissions, including raw material extraction, agriculture, processing, manufacturing, packaging, and transportation; excludes retail waste and end-of-life emissions.
⁶Electrification of transport, though it has emissions distributed across whole value chain, is attributed to action taker closest to retailer (tier 1 supplier) because of high level of influence over entire supply chain.
T-shirt production
Beef production
Electronics production
Printed circuit board
Abatement levers across the value chain⁵
Renewable electricity in production
Perfluorocarbons gas best practice abatement
Low-greenhouse-gas chemicals in fab production
Take-back scheme
1
2
3
4
Battery
Renewable electricity in manufacturing
Biogas for heating
Recycled battery materials
Yield improvement and scrap recycling
5
6
7
Materials
9
10
11
Plastic: low CO₂ sourcing
Aluminum: low CO₂ process tech
Glass: increased recycled content
Switch magnesium to aluminum
12
13
14
Packaging and transportation
Substitution of plastics
with cardboard
Electrification of transport⁶
Switch to recycled cardboard
16
17
8
Aluminum: electrification and renewable electricity
Steel: low CO₂ sourcing for steel (eg, hydrogen direct reduced iron, recycled)
Glass: biogas for heating
15
18